-
6th, 7th, 8th Grades
- Project
- 3 weeks
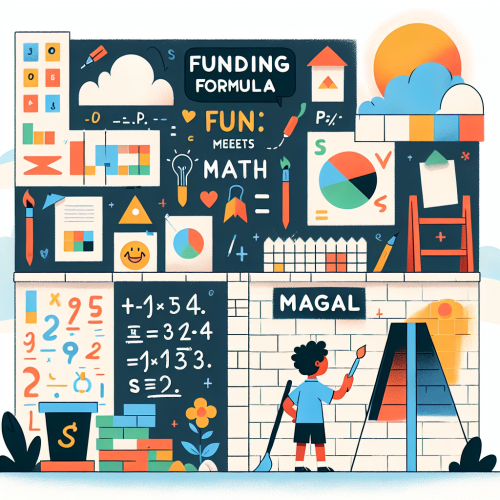
Funding Formula Fun: Math Meets Mural Magic!
CCSS.Math.Content.HSA-CED.A.1
CCSS.Math.Content.HSA-CED.A.2
CCSS.Math.Content.HSA-CED.A.3
Purpose
This project aims to equip students with the mathematical skills necessary to analyze real-world data on school funding disparities. By engaging with authentic data from local school districts, students will develop and apply equations and inequalities to model and interpret these disparities. Through collaborative projects and community partnerships, students will gain a deeper understanding of equity and justice in education, fostering critical thinking and problem-solving skills that can inspire meaningful change.
Learning goals
Students will develop skills in creating and solving equations and inequalities to model real-world scenarios, specifically focusing on school funding disparities. They will learn to graph equations and interpret constraints, using mathematical models to analyze and present data effectively. Through collaboration and reflection, students will enhance their understanding of equity and justice in education, applying mathematical reasoning to advocate for change.
Standards
- CCSS.Math.Content.HSA-CED.A.1 - Create equations and inequalities in one variable and use them to solve problems. Include equations arising from linear and quadratic functions, and simple rational and exponential functions.
- CCSS.Math.Content.HSA-CED.A.2 - Create equations in two or more variables to represent relationships between quantities; graph equations on coordinate axes with labels and scales.
- CCSS.Math.Content.HSA-CED.A.3 - Represent constraints by equations or inequalities, and by systems of equations and/or inequalities, and interpret solutions as viable or nonviable options in a modeling context.
Products
Throughout the project, students will develop a series of mathematical models and graphs that depict the disparities in school funding, using real-world data from local school districts. By the end of the project, they will create a comprehensive presentation showcasing their analyses, which will include visual aids such as charts and graphs to clearly communicate their findings. Additionally, students will collaboratively design and construct a 'Mathematical Mural' that visually represents their data-driven insights, serving as both an educational tool and a conversation starter for community engagement during the open house event.
Launch
Begin the project with a "Funding Reality Walk," where students visit local schools with varying funding levels, observing differences in facilities, resources, and opportunities. Encourage students to take notes and photos to capture their observations. Follow the walk with a group discussion to share initial impressions and questions, setting the stage for deeper exploration of funding disparities through mathematical analysis.
Exhibition
Students will collaboratively design a 'Mathematical Mural' that visually represents their data findings on school funding disparities. This mural will be displayed during an open house event, inviting community members to engage with the artwork and the students' insights. The exhibition will serve as a platform for students to articulate their mathematical processes and interpretations, fostering a dialogue on equity in education.
| Week 1 | Day 1 | Day 2 | Day 3 | Day 4 | Day 5 |
|---|---|---|---|---|---|
| Activities |
Funding Reality Walk - Visit local schools with varying funding levels, observe differences, and take notes and photos to capture observations (40 min)
|
Group Discussion - Share initial impressions and questions from the Funding Reality Walk, fostering a deeper exploration of funding disparities (20 min)
Essential Question Introduction - Introduce and discuss the essential question: 'What mathematical strategies can we employ to visualize and interpret the differences in school funding, and how can these insights drive change?' (20 min)
|
Data Analysis Workshop - Work with local school district data to identify disparities in funding, focusing on understanding the types of data and variables involved (40 min)
|
Equation Creation Session - Create equations and inequalities using data variables to model funding disparities, focusing on CCSS.Math.Content.HSA-CED.A.1 (20 min)
Graphing Equations - Graph equations on coordinate axes, ensuring labels and scales accurately represent funding relationships (20 min)
|
Constraints Exploration - Represent constraints by equations/inequalities and interpret solutions as viable/nonviable options within funding contexts (20 min)
Reflection Circle - Discuss findings and feelings about the disparities in school funding, emphasizing how these insights impact understanding of equity and justice (20 min)
|
| Deliverables |
1. A series of notes and photos from the 'Funding Reality Walk' that document observations of disparities in school funding.
2. A set of initial questions generated by students that will guide their mathematical exploration of funding disparities. 3. A list of variables and constraints identified by students to model school funding disparities. |
||||
| Preparation |
1. Coordinate with local school districts to arrange visits for the 'Funding Reality Walk.'
2. Prepare materials such as notebooks, cameras or tablets for students to document observations during the walk. 3. Gather data on school funding disparities from local school districts to support students' analyses. 4. Provide graphing tools and resources for students to visualize equations, such as graph paper, rulers, and graphing calculators. 5. Organize a comfortable space for the reflection circle where students can openly discuss their findings and emotions. |
||||
| Week 2 | Day 1 | Day 2 | Day 3 | Day 4 | Day 5 |
|---|---|---|---|---|---|
| Activities |
Data Analysis Introduction - Students examine real-world school funding data, identifying key variables and discussing potential equations to represent these relationships (40 min)
|
Equation Creation Workshop - Students work in pairs to create equations in one variable to model school funding based on identified factors, using the data from Day 1 (40 min)
|
Graphing Equations - Students graph their equations on coordinate axes, ensuring proper labels and scales, and discuss patterns and anomalies in the data (40 min)
|
Constraints and Inequalities - Students explore how constraints can be represented through inequalities and systems of equations, applying them to their school funding models (40 min)
|
Reflection Circle - Students participate in a reflection circle to share insights and feelings about the data and disparities observed, focusing on equity and justice (20 min)
Preparation for Presentation - Begin drafting their presentations, including graphs and models developed throughout the week to illustrate funding disparities (20 min)
|
| Deliverables |
1. A set of equations and inequalities representing funding disparities.
2. Graphs illustrating the relationships between different funding variables. 3. A preliminary group presentation of mathematical models, including interpretations and analyses of funding disparities. |
||||
| Preparation |
1. Collect and prepare real-world data on school funding from local school districts for student access.
2. Provide graphing tools and resources such as graph paper, rulers, and colored pencils for visual representation. 3. Organize a digital platform for students to collaborate and share their data findings and models. 4. Facilitate access to online graphing calculators or software to assist in creating and analyzing graphs. 5. Prepare guiding questions and reflection prompts for the reflection circle to encourage deeper discussion. |
||||
| Week 3 | Day 1 | Day 2 | Day 3 | Day 4 | Day 5 |
|---|---|---|---|---|---|
| Activities |
Feedback Session - Students share their initial models with peers for feedback, focusing on clarity and accuracy of mathematical representations (20 min)
Model Refinement - Using peer feedback, students revise their equations and graphs to better represent funding disparities (20 min)
|
Presentation Preparation - Students begin creating presentations that include their refined models, ensuring they articulate their mathematical processes and interpretations (40 min)
|
Presentation Rehearsal - Students practice presenting their findings to classmates, receiving suggestions for improvement on clarity and engagement (20 min)
Final Presentation Edits - Students make final adjustments to their presentations based on rehearsal feedback (20 min)
|
Mathematical Mural Planning - Students collaboratively design how to visually represent their data findings in a mural, deciding on layout and key messages (20 min)
Mural Creation - Begin constructing the Mathematical Mural, ensuring accurate and creative representation of data insights (20 min)
|
Exhibition Preparation - Finalize the Mathematical Mural and prepare the space for the open house event, ensuring all elements are ready for community engagement (20 min)
Reflection Circle - Reflect on the entire project, discussing insights gained about school funding disparities and their impact on understanding equity and justice (20 min)
|
| Deliverables |
1. Students will finalize their presentations, including graphs and models that depict funding disparities, and prepare to present their findings to classmates and community members.
2. Complete a collaborative 'Mathematical Mural' that visually represents the data findings on school funding disparities. 3. Organize an open house event where students exhibit their presentations and the Mathematical Mural to invite community engagement. |
||||
| Preparation |
1. Secure a venue and set up space for the open house event, ensuring adequate room for presentations and mural displays.
2. Coordinate with local school district representatives or community partners to attend the open house and provide feedback on students' work. 3. Arrange necessary materials for mural creation, including large canvases, paint, markers, and other art supplies. 4. Provide access to computers or tablets for students to finalize and practice their digital presentations. 5. Ensure availability of audiovisual equipment for presentations, such as projectors, microphones, and speakers. 6. Prepare reflection prompts to guide students through discussing their findings and experiences during weekly reflection circles. 7. Organize logistics for inviting parents, community members, and local media to the open house event. |
||||