8th Grade  Project 1 week

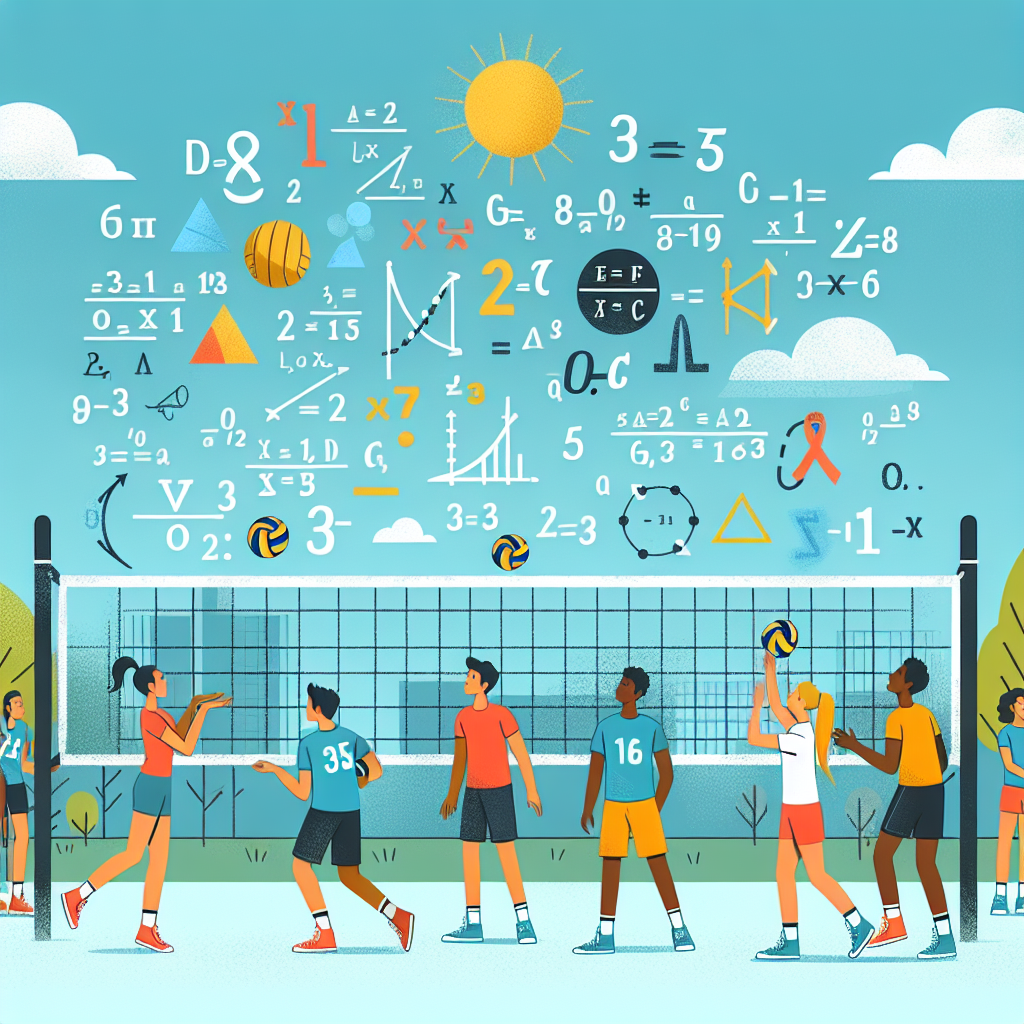
Volleyball Equation Predictors: Stats in Action!

Jazmin R
CCSS.Math.Content.8.EE.B.5
CCSS.Math.Content.8.F.A.3
CCSS.Math.Content.8.F.B.4
1-pager

Purpose

In this project, students will explore the application of linear functions by analyzing real volleyball game statistics to identify patterns and predict future game outcomes. Through collaborative data collection and graphing activities, students will deepen their understanding of mathematical concepts while enhancing their teamwork and communication skills. This hands-on experience will allow students to see the relevance of math in sports, fostering a connection between classroom learning and real-world applications.

Learning goals

Students will analyze volleyball game data to identify patterns and predict outcomes using linear equations. They will develop skills in graphing proportional relationships and interpreting linear functions, focusing on the rate of change and initial values. Through collaborative group work, students will enhance their teamwork and communication abilities while applying mathematical concepts to real-world scenarios. Additionally, students will reflect on their learning journey and document insights in their journals, fostering a deeper understanding of how mathematics can model and influence sports analytics.
Standards
  • CCSS.Math.Content.8.EE.B.5 - Graph proportional relationships, interpreting the unit rate as the slope of the graph. Compare two different proportional relationships represented in different ways.
  • CCSS.Math.Content.8.F.A.3 - Interpret the equation y = mx + b as defining a linear function, whose graph is a straight line; give examples of functions that are not linear.
  • CCSS.Math.Content.8.F.B.4 - Construct a function to model a linear relationship between two quantities. Determine the rate of change and initial value of the function from a description of a relationship or from two (x, y) values, including reading these from a table or from a graph. Interpret the rate of change and initial value of a linear function in terms of the situation it models, and in terms of its graph or a table of values.

Products

Students will create a comprehensive project portfolio that includes graphs of volleyball game statistics, showcasing their ability to construct and interpret linear functions. This portfolio will feature visual representations of proportional relationships, comparisons of different data sets, and analyses of rate of change and initial values. Additionally, students will present their findings in a group presentation, demonstrating their understanding of how linear equations can predict game outcomes and reflecting on their teamwork and communication skills.

Launch

To kick off the project, students will participate in a simulated volleyball tournament where they will collect data on key statistics such as serves, spikes, and blocks. During the game, students will work in teams to record data points, which they will later use to create graphs and analyze linear relationships. This hands-on experience will serve as a foundation for understanding how mathematical concepts apply to real-world scenarios, setting the stage for their week-long exploration of linear functions through volleyball statistics.

Exhibition

Students will host a "Volleyball Math Expo" where they present their findings on how linear functions can predict volleyball game outcomes. They will display graphs and tables of collected game data, explaining the rate of change and initial values in their models. The expo will include interactive stations where attendees can engage with the data and ask questions, fostering a deeper understanding of the mathematical concepts applied.