Design with DEEDS
Build projects and skills that matter.
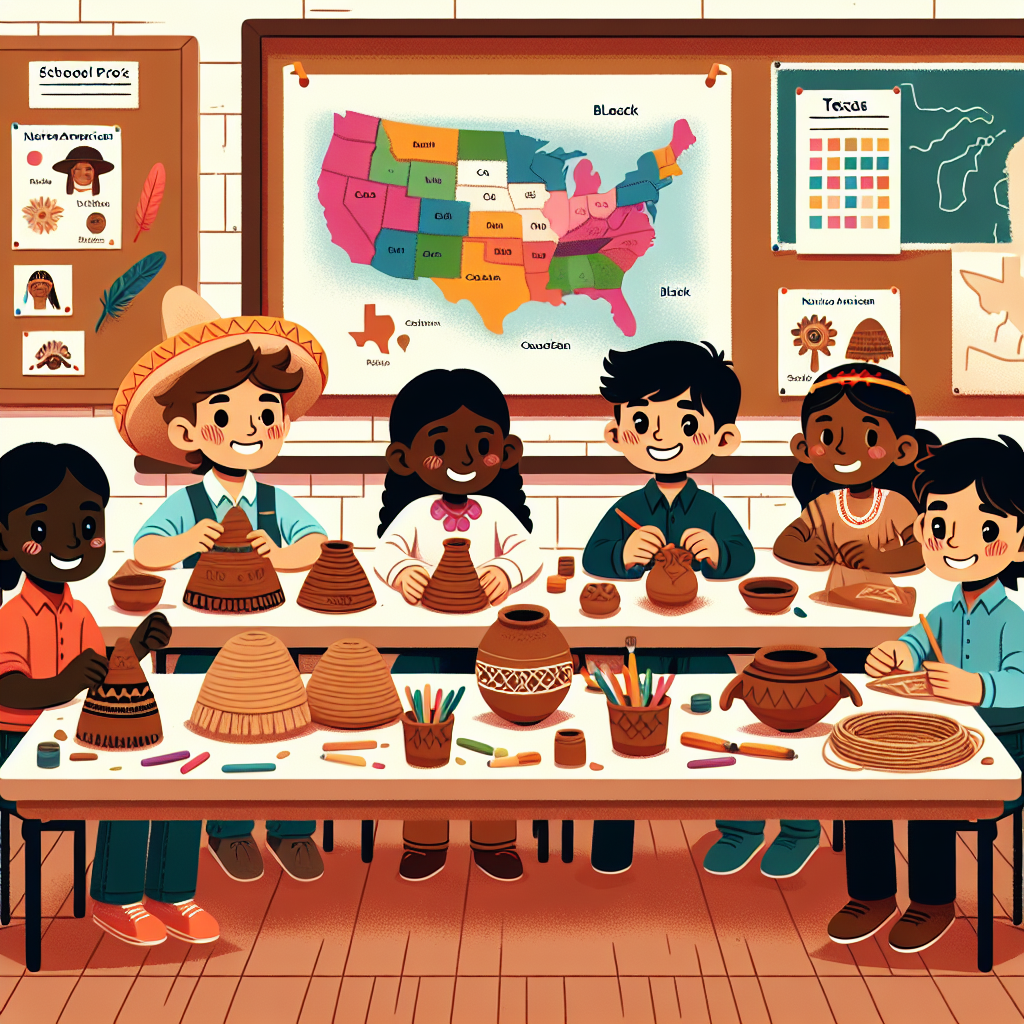
The DEEDS Design Tool creates meaningful learning journeys rooted in relevant community topics, student voice, career skills and real-world problem-solving.
Build projects and skills that matter.
The DEEDS Design Tool creates meaningful learning journeys rooted in relevant community topics, student voice, career skills and real-world problem-solving.

Grade Level(s): 6th Grade

Grade Level(s): Kindergarten, 1st Grade, 2nd Grade, 3rd Grade, 4th Grade, 5th Grade, 6th Grade, 7th Grade, 8th Grade, 9th Grade, 10th Grade, 11th Grade, 12th Grade
Grade Level(s): Kindergarten

Grade Level(s): Pre-k
Grade Level(s): 6th Grade

Grade Level(s): Middle School

Grade Level(s): Kindergarten, 1st Grade, 2nd Grade, 3rd Grade, 4th Grade, 5th Grade, 6th Grade, 7th Grade, 8th Grade, 9th Grade, 10th Grade, 11th Grade, 12th Grade

Grade Level(s): Kindergarten, 1st Grade, 2nd Grade, 3rd Grade, 4th Grade, 5th Grade, 6th Grade, 7th Grade, 8th Grade, 9th Grade, 10th Grade, 11th Grade, 12th Grade
Powered by Inkwire's cutting-edge AI model, educators & learners can now create comprehensive project-based learning at the push of a button.
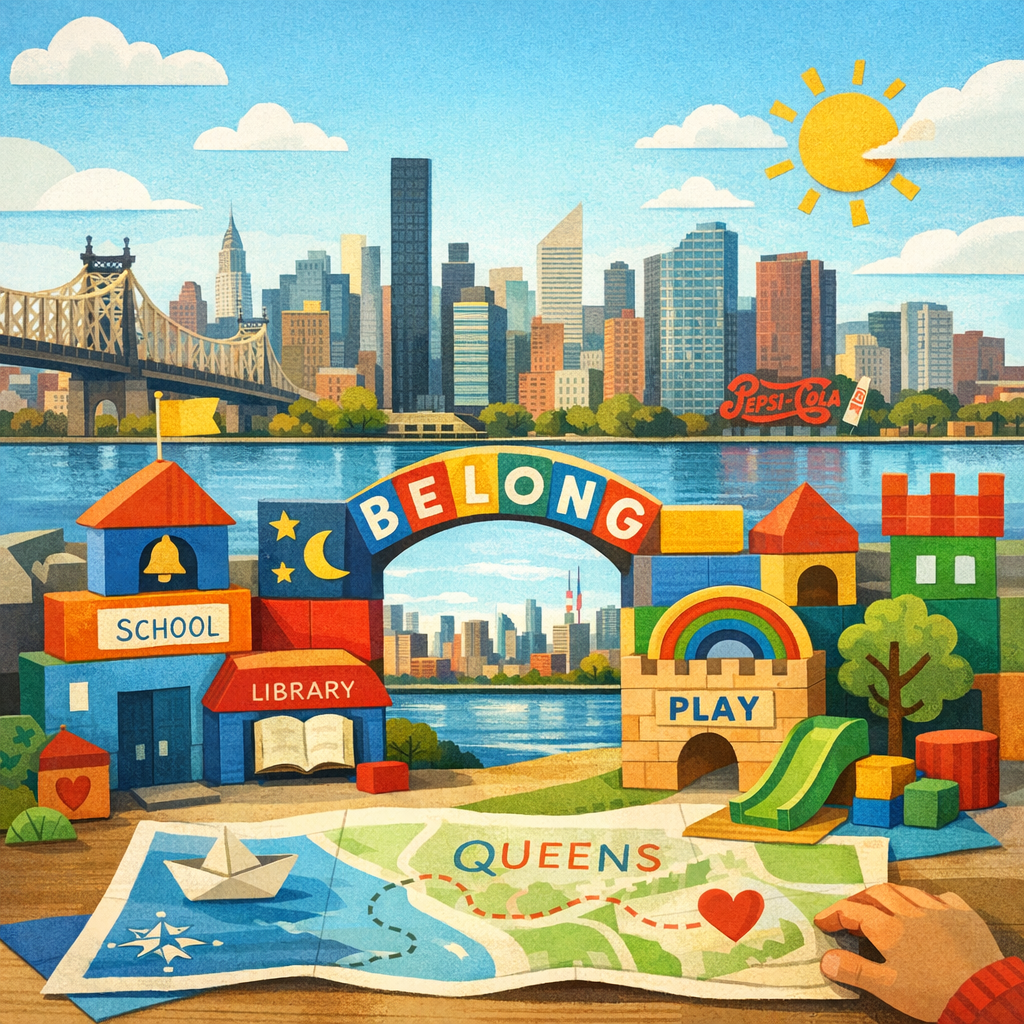
Rooted in YOUR community's context! Teaching and learning can focus on relevant issues and/or local or global business needs. Learning has never been more impactful.
DEEDS integrates standards and researched-backed practices into the learning journey for improved academic outcomes and enhanced professional skills.
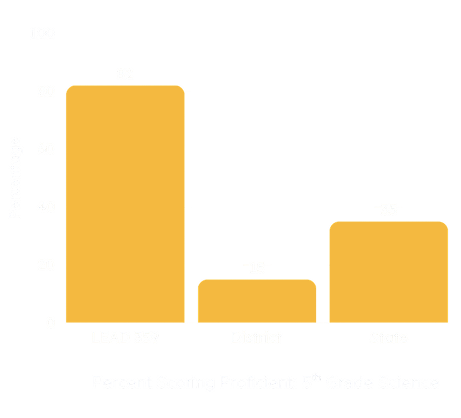
At LEAD 359, a K-8 Public School in Bronx, New York, students were more than twice as likely to meet grade-level standards.
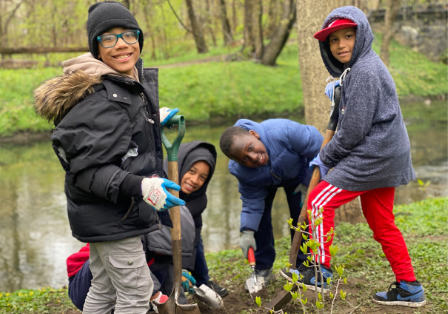
"Before, I didn't like science... but now, I want to be an ecologist when I grow up!"
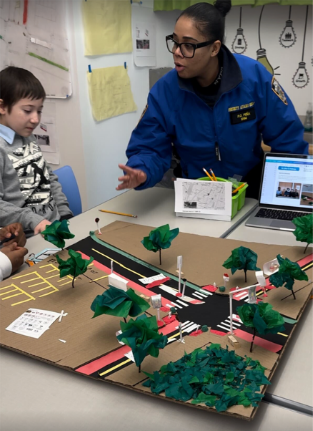
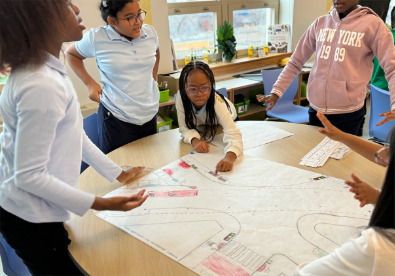
"I can't believe they are listening to my ideas. Like I can literally help make the intersection safer."
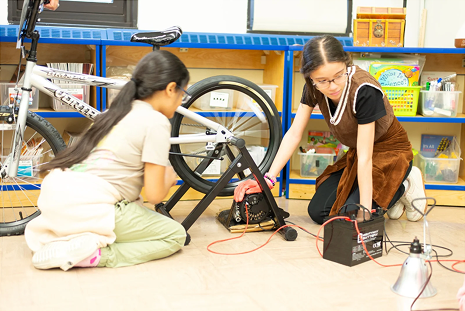
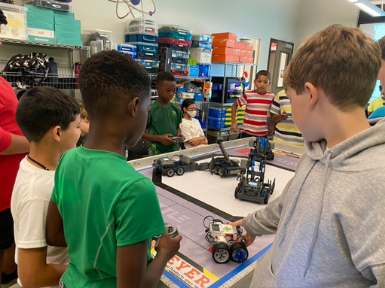
"It's not working, what do we do now?" "Let's try to make it better."