
Design for Deeper Learning
Collaborate with AI to design an engaging learning experience in minutes.
Try it out – design your own projectCollaborate with AI to design an engaging learning experience in minutes.
Try it out – design your own project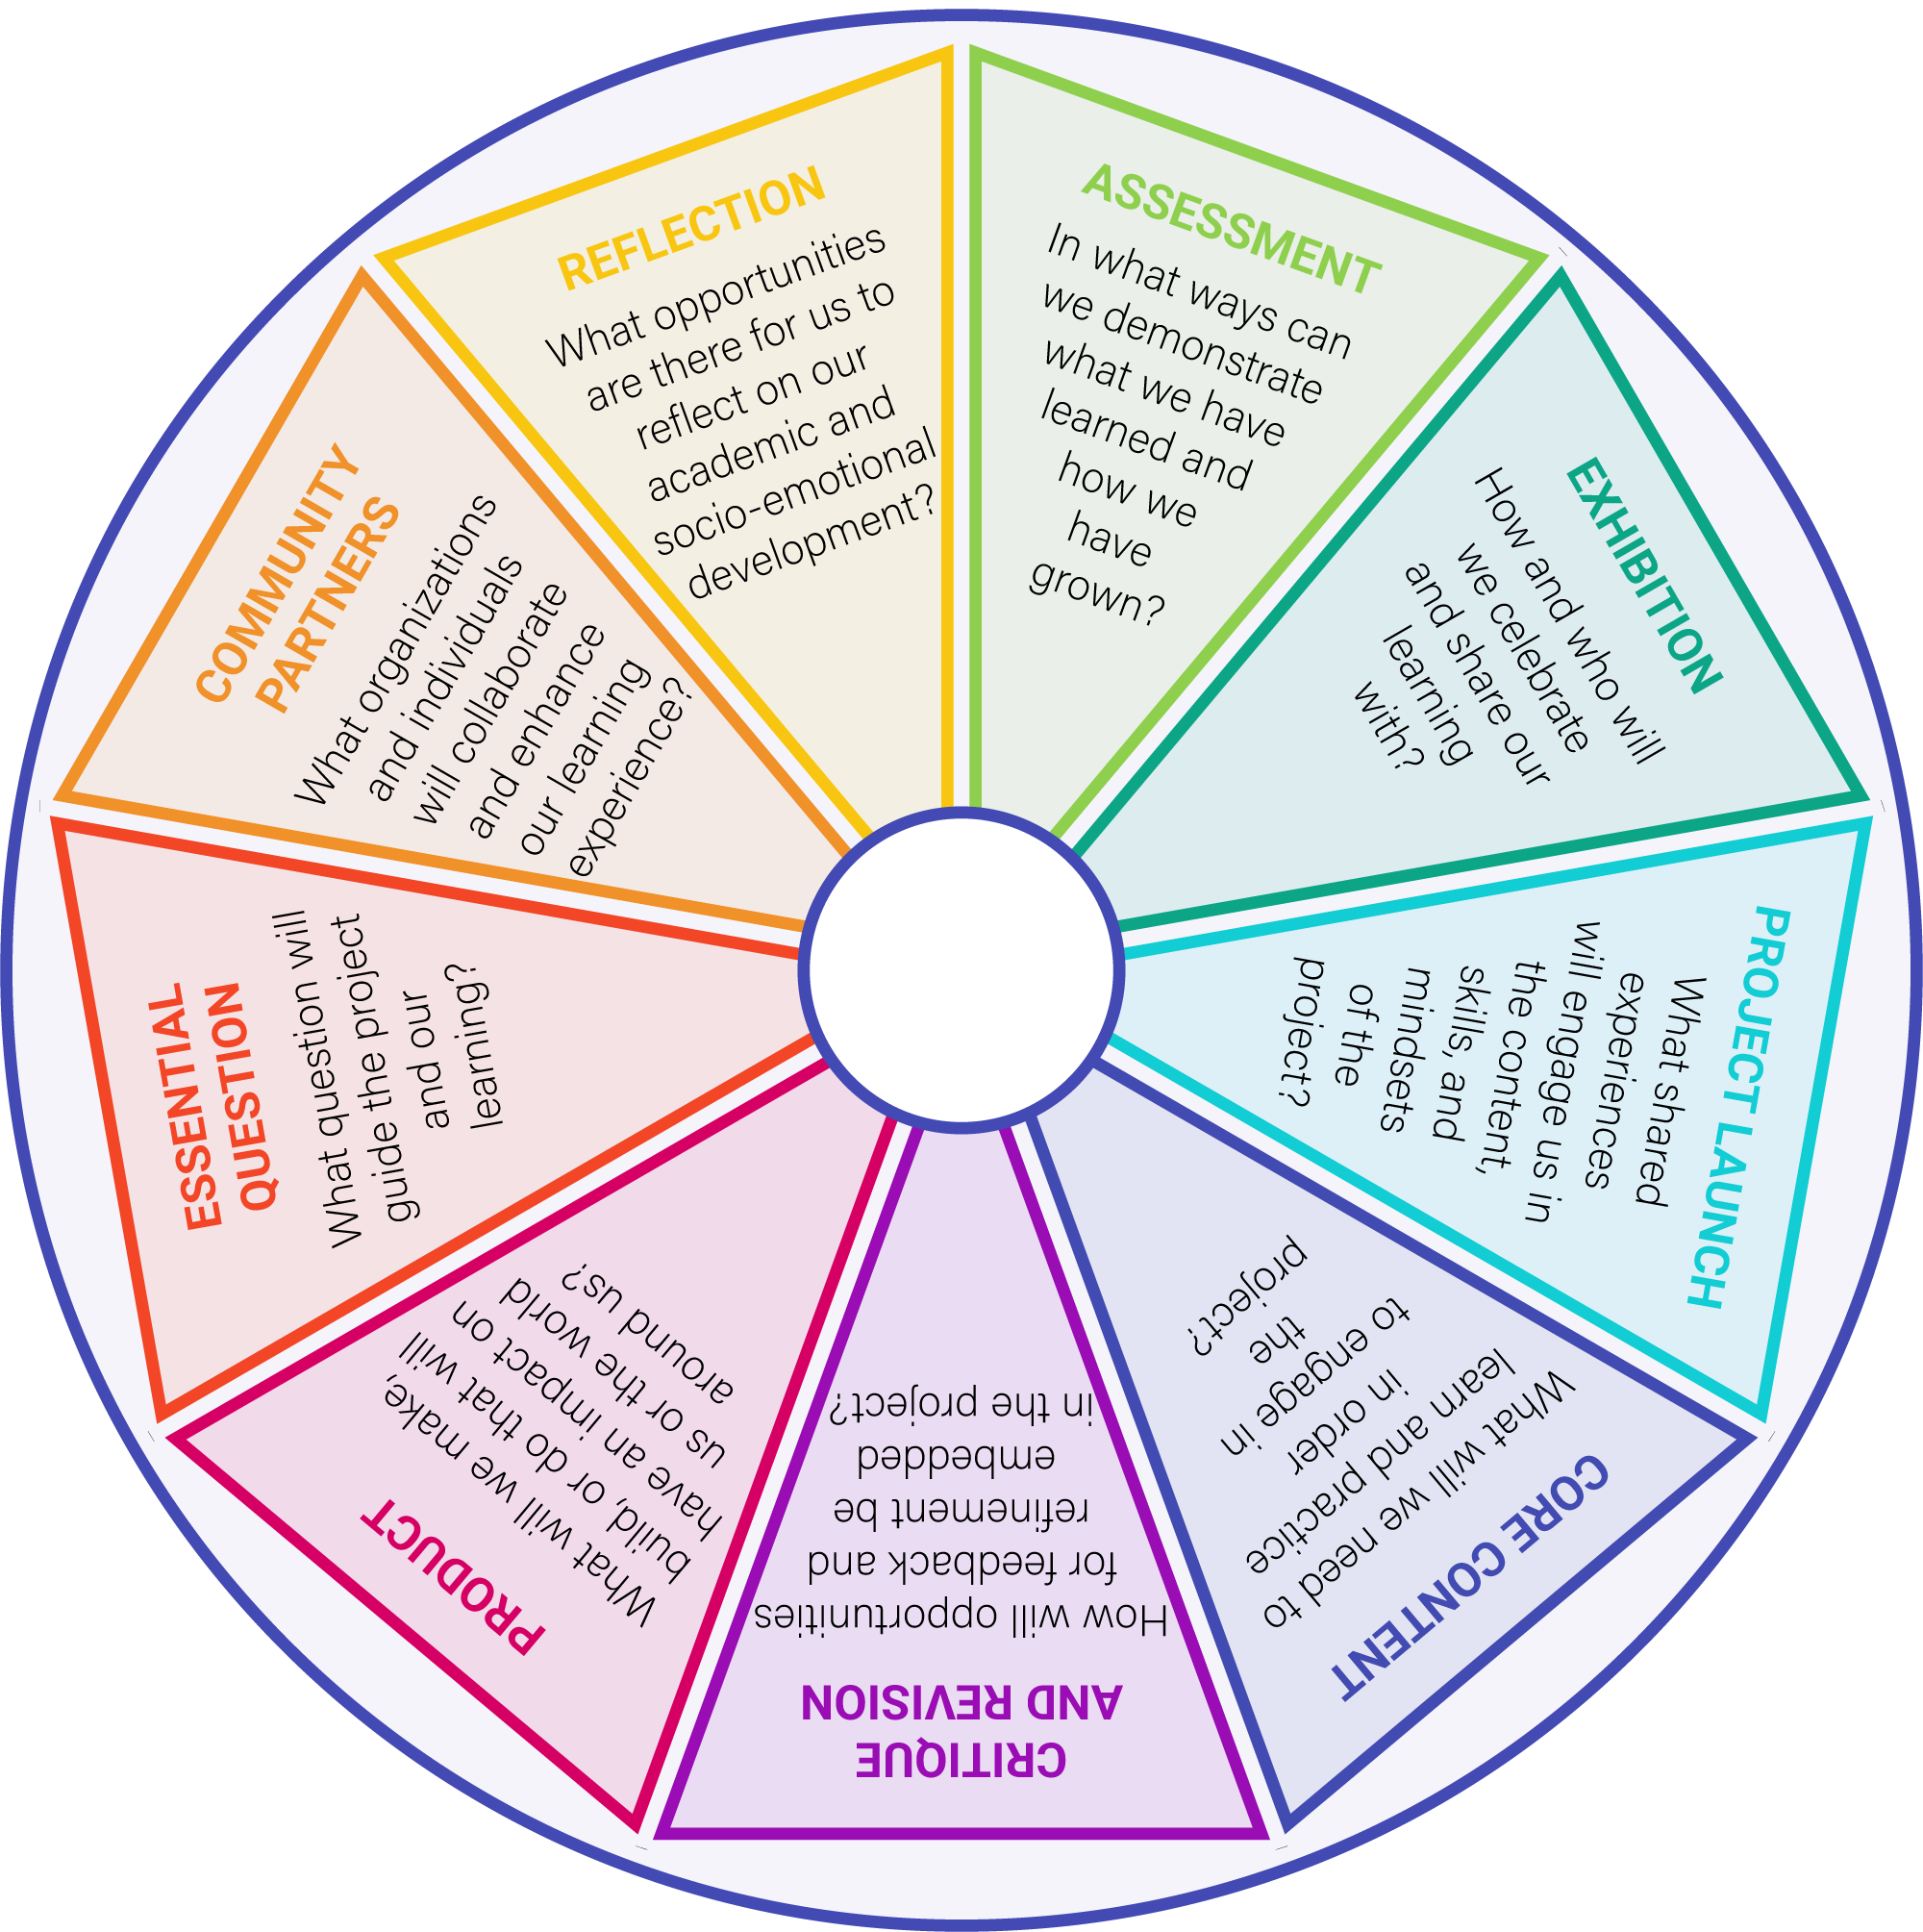

Sherman Heights Ofrenda Design Adventure
Grade Level:
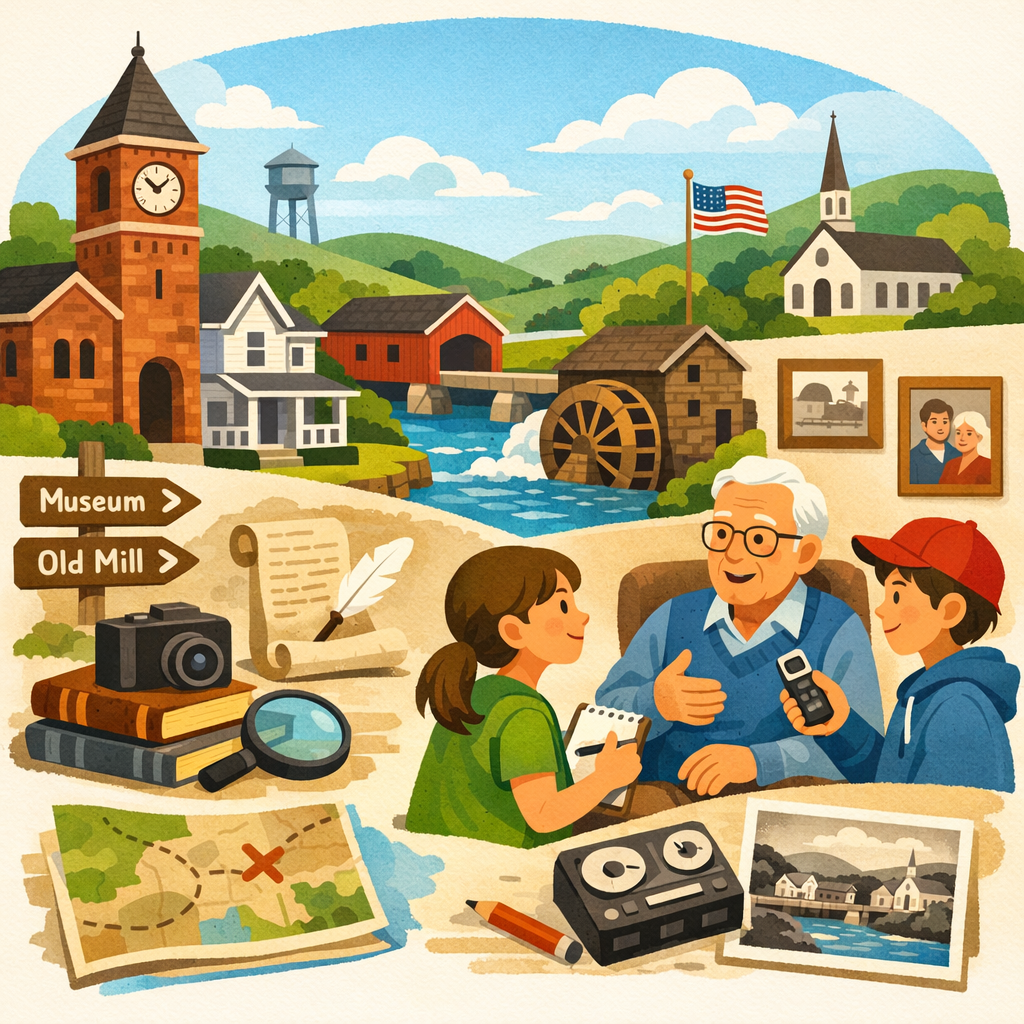
Town Time Travelers: Unveil Our Past!
Grade Level:

Wild About Animal Classification
Grade Level:

Dusty Adventures: Roaming the Dustbowl!
Grade Level:

Water Wonders: Biology Splash!
Grade Level:

Our Dream School Adventure
Grade Level:

Sense-Around Sacramento Adventure
Grade Level:

Native American Tribes in the State of Texas
Grade Level:
What if there was a tool to help us take our wild project ideas and create a scope and sequence? There is! Inkwire and the Professional Learning team at High Tech High’s Graduate School of Education designed an AI-assisted curriculum planning tool.
Powered by High Tech High's Kaleidoscope framework for project-based learning (PBL) design, this AI assistant helps educators – and learners! – integrate standards and curriculum requirements into a cycle of PBL Essentials.